Analytical data
GPSControl monitoring system allows you to fully analyze information about usage of your fleet along with supply deliveries, thus giving you exact measures of staff efficiency. To achieve this result GPSControl uses data received from trackers and turns it into easily readable and understandable graphical charts and reports.
Reports
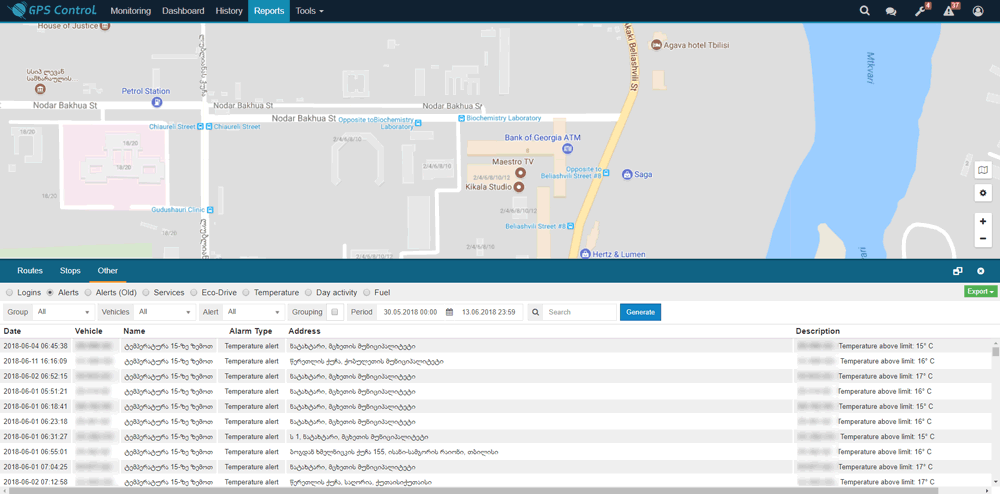
Reports are divided into several different groups for different kinds of usage making it easy for you to find just the report you are looking for. Below we describe several daily used reports by majority of our users.
- Routes- the data is summed up by days or devices. Report shows you information about employee's duration of work as well as vehicle usage duration and specific data like how long did the driver use the car, how long was the whole trip, fuel usage and average speed. This report can be viewed according to predefined period that suits your personal needs and using additional filters data can be sorted in relation with specific days or geofences.
- Stops - Summed up data about routes in relation with specified number of stops, driving duration, places or used fuel. By clicking an entry you will be shown the start and the end of the route and the duration of it on map.
- Alerts - A detailed report about all the alert you have received.
- Services-Detailed report about registered services with completion status
- Fuel report - Report comparing predefined fuel limit to actually used fuel.

Dashboard
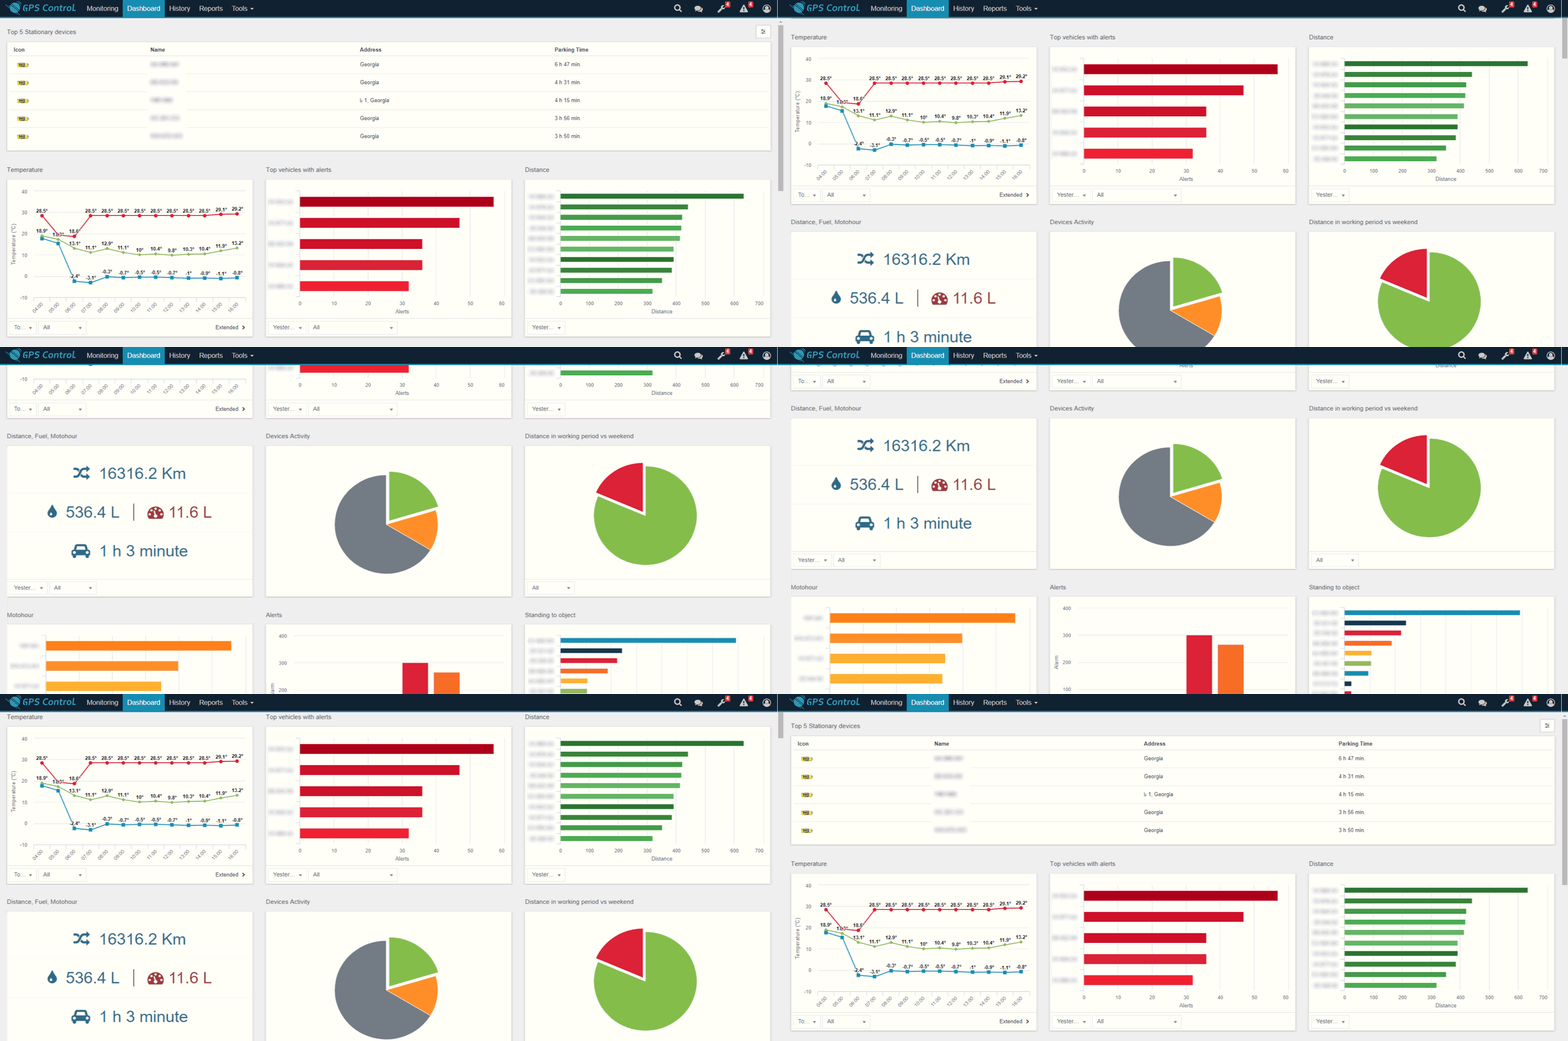
Your fleet data can be reviewed from Dashboard as well as reports. In Dashboard data is presented as graphical charts summing up changing tendencies in your fleet. You can view charts about cars who have activated most numbers of alerts, or most visited objects by your fleet. Dashboard also offers interesting data about full traveled distance and used fuel as well as idling hours.
